A linear rational function is a function of the form `f(x)=\frac{a\mathrm{x}+b}{c\mathrm{x}+d},a, b,c, d \in \mathbb{R}, d \neq 0`

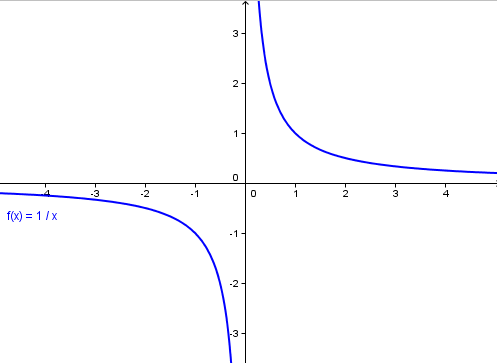
The graph of a linear rational function is a hyperbola, and you have already seen its formula. However, there is one detail you need to be aware of. If , then the graph of the function is a line with the formula
.
Properties of the Function
- The domain of definition includes all real numbers except one. The denominator must not be zero, so we know that `cx + d \neq 0`. By rearranging this inequality, we find that the domain of the function is:
- The range is
- The function is unbounded and has neither a maximum nor a minimum.
- For
, the function is increasing over its entire domain.
- For , the function is decreasing over its entire domain.
- The function has two asymptotes: `x=-\frac{d}{c}, y=\frac{a}{c}`
Graph Sketch
When tasked with sketching the graph of a function, you can calculate its behavior, but this is a long and often difficult process. However, if you recognize that it is a linear rational function, there is a handy method for sketching its graph. If you can transform the function into the form `f(x)=\frac{a}{x+m}+n; a, m, n \in \mathbb{R}`, you can easily sketch its graph.
Converting a linear rational function to this form is straightforward – you simply divide the function into two polynomials:
However, memorizing such a formula is probably unnecessary; it's always easier to simply divide the polynomials.
Convert the function into the other form:
So, we have:
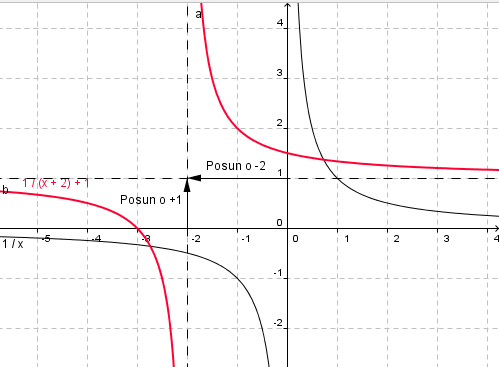
You know how to convert it. Now for the actual graph sketch according to the formula `f(x)=\frac{a}{x+m}+n; a, m, n \in \mathbb{R}`:
If, then the function is increasing. If , the function is decreasing. The parameters
determine the shift along the
xandyaxes. It shifts byalong the positive
xaxis and byalong the positive
yaxis.
For the function , it looks like this:

Let's try it again. Determine the domain and range of the function
The domain and range are obtained simply by substituting into the formula.
- `D_f = \mathbb{R}\backslash\left\{-\frac{d}{c}\right\}=\mathbb{R}\backslash\left\{-2\right\}`
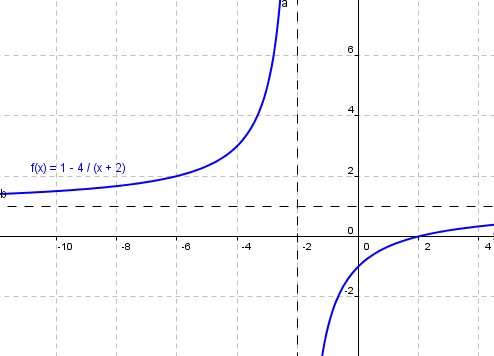
To sketch the graph, we need to adjust the function:
From this form, you can easily sketch the graph:
